Precipitation Trends 2023-24
NEWS BEFORE THE NEWS
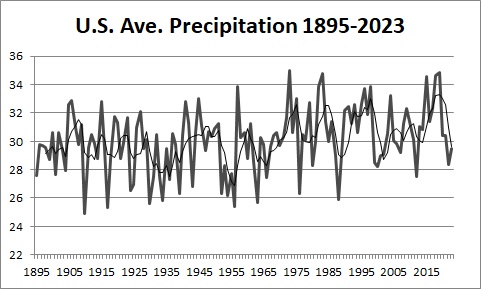
PRECIPITATION
National average precipitation is an accurate indicator of the economy. It is often a ‘leading indicator’ of what is to come. Wet trends correspond with bull markets and a growing economy. Dry trends correspond with bear markets and a shrinking economy.
THE CURRENT CONDITION
The sharp drop in precipitation in 2020 spelled a dismal year for the economy. The Moon’s declination in 2020 was near mid-range (23.50) in Cancer – a sign of unfavorable, dry weather conditions. Gross Domestic Product responded accordingly by decreasing -3.4%. A leveling off of drier conditions during 2021 helped the economy grow by a robust 5.7%. Jupiter/Neptune conjunctions, like the one in 2022, have usually been associated with wet years like 2021. 2022 however was terribly dry resulting in the GDP rising to only 1.9%. As a result of the sudden dryness in 2022 economic conditions in terms of high inflation and interest rates continued to worry consumers in 2023. Precipitation rose in 2023 but is still over ½ inch below average. The stock market responded favorably to the rise in moisture while the economy in general grew 2.5%. A wetter 2023 should continue as the lunar north node moves into Aries during its greatest declination.
PREVIOUS CYCLES
Notice (in the graph) the wet 1990s when the stock market was roaring. The weather went dry in 1996 and reached a drought bottom in 2000. The stock market promptly crashed in 2001. 2001 and 2002 were wetter than 1999 and 2000 but still not moist enough to regenerate the economy. 2003 continued the wet trend and 2004 witnessed a precipitation high. The stock market responded favorably to this wet trend. 2005 and 2006 were drier than 2004 but the stock market weathered this warning until ultra-dry 2007 ushered in The Great Recession beginning in October.
2008 and 2009 were both wet years indicating the slow rise in stock prices but 2010, 2011, and 2012 were dry again. 2012 was the driest year since 1988. This offers an explanation for the shaky and long economic recovery after the Great Recession. Precipitation as a leading economic indicator pointed to a continued grim economic picture through 2012. The stock market did rally during this period but the overall economy remained mired in high unemployment – millions of workers have even given up trying to get a job – and 22% of citizens are on food stamps.
2013, however, reverses the short dry trend with dramatic exceptions in parts of the Southwest and particularly California, a major world food producer. 2014 was favorable for the economy as forecast last year based on the precipitation index. Notice that precipitation dipped slightly in 2014 and then soared in 2015. 2015 was a very wet year. The stock market responded by posting the highest gain ever but retreated from this record by years’ end. Extremely wet 2015 is a good sign that the economy will dramatically improve as crop yields flourish from 2015-2019.
2016 was indeed a good year for the stock market. The economy, however, grew by only 1.6%. 2016 turned drier than 2015 but precipitation still remained relatively high on average (note trend line). This was a boon to incoming president Trump and his promises and expectations to stimulate the economy. The market did indeed do well in 2017, despite only a moderate rise in moisture, recording a GDP of 2.4%. Precipitation levels rose substantially in 2018 and the economy responded dramatically, posting a 2.9% growth rate, following president Trump’s agenda for putting American interests first: enacting historic tax cuts, business deregulations, and new foreign trade and treaty deals.
The precipitation increase from 2013-2019 indicates favorable economic developments going into 2020. The economy did show positive signs of growth with 2.9% GDP in 2018 and slightly less, 2.3%, in 2019. Previously I stated that, “the drier conditions anticipated did not materialize in 2019 but are likely to do so in 2020 signaling a significant worldwide financial crash.” This prediction has come true with the March 2020 Covid-19 stock market plunge.
THE HISTORICAL RECORD
The Gilded Age of the 1890s and early 1900s was a boom time for industrial production and investment tycoons but not so for the average worker. The first trend peak (high) was in 1908 followed by three mediocre rises and falls centered in 1912 (low), 1915 (high), 1919 (low), 1923 (high), 1925 (low), and finally the high of 1929. World War I and its aftermath, plus Prohibition and the “Roaring ‘20s” followed this seesaw pattern. Notice the very dry 1930s that gave rise to the Dust Bowl, the Great Depression, and the rise of fascism. Wet conditions peaked again in 1947 showing the productivity of World War II and the resulting prosperity. The sharp dry trend bottom in 1956 corresponded with the Cold War and the Eisenhower presidency. Just as quickly as it became notably dry a turn to wetter conditions appeared in the trend peak of 1960, marking the end of a golden era and the beginning of the young JFK presidency. The trough in 1966 brought civil unrest, the Vietnam War, staggering economic debt, a counter-culture revolution, the assassination of JFK, the Johnson administration’s Great Society, and the rise and fall of Nixon. The peak in 1975 correlated with the end of the unpopular Vietnam War and some prosperity before the War Recession and the 1978 trough. The following peak in 1984 came during the prosperous and exuberant Reagan years. The next dry trough in 1989 produced Black Monday on Wall Street – October 19, 1987. The beginning of a long and questionable entanglement in the Middle East started in this dry period during the first Gulf War (George H.W. Bush administration). The 1990s, centering on the wet trend peak in 1998, was a decade of decadence and amazing prosperity during the first “Baby Boom” president, Bill Clinton. The War on Terrorism after the 9/11 attacks correlated with the dry trough of 2002 and more economic instability. The dry period after 1998 until 2003 correlated with the controversial invasion of Iraq during George Bush’s presidency and the defeat of Saddam Hussein in the Iraq War. The Iraq and Kuwait oil fields were secured and Saudi fields protected by this successful operation but warlords in Iraq, Syria, and Iran rose to the occasion and challenged the American presence. The short dry trend after 1998 appears similar to the one in the 1950s – a conservative time of measured, progressive growth.
The peak of wet conditions in 2008 and dry conditions afterward led to the Great Recession during Barrack Obama first year in office. His two terms were not stellar in terms of the economy as evidenced by the slow upward arc of the precipitation trend line. Luckily wet 2015 helped the economy briefly until drier conditions resumed in 2016-17. The lackluster economy in Obama’s last years in office helped Donald Trump in the 2016 election win a surprising victory over Hillary Clinton. The economy responded dramatically in wet 2018 and 2019 based on Trump tax cuts, business regulation reduction, trade dispute resolutions, and other socially conservative policies. Dry 2020 ushers in a new Democrat president, Joe Biden, with his party controlling both the House and Senate.
It is apparent from the historical overview of precipitation that prosperity and good times prevail during wet trends. Dry periods depress the economy and mire the country into wars, civil unrest, and poor policies.